Friday, March 8, 2013

SCOM 2012 - How to Generate Alerts from the Event Log

As a continuation of how to set up some custom monitors I wanted to expand out the previous segment on How to Generate Alerts from a Log File and talk about how to create an alert from an event in the Event Logs. If you are given a choice monitoring the event log is preferable to monitoring a log file as the results tend to be a bit more consistent, at least in my experience.

First go to the Authoring space.Then go to Management Pack Objects then Monitors. Go ahead and scope the list for Windows Computers. Expand out Windows Computers and Entity Health. Right Click on Availability and select Create a Monitor then Unit Monitor...

When the Create a unit monitor wizard opens up expand out Windows Events then Repeated Event Detection (we did Simple Events last time so this time I want to show you how to look for repeated events). When you get to Repeated Events you again have three choices:
  • Manual Reset - 1 State, Alert - Manually resolve
  • Timer Reset - 2 State, Alert and Auto Resolve (Time Based)
  • Windows Event Reset - 2 State, Alert and Auto Resolve
For this example we are going to use Timer Reset. Select a management pack and Click Next

In General Properties, go ahead and give the monitor a name, uncheck Monitor is enabled and Click Next

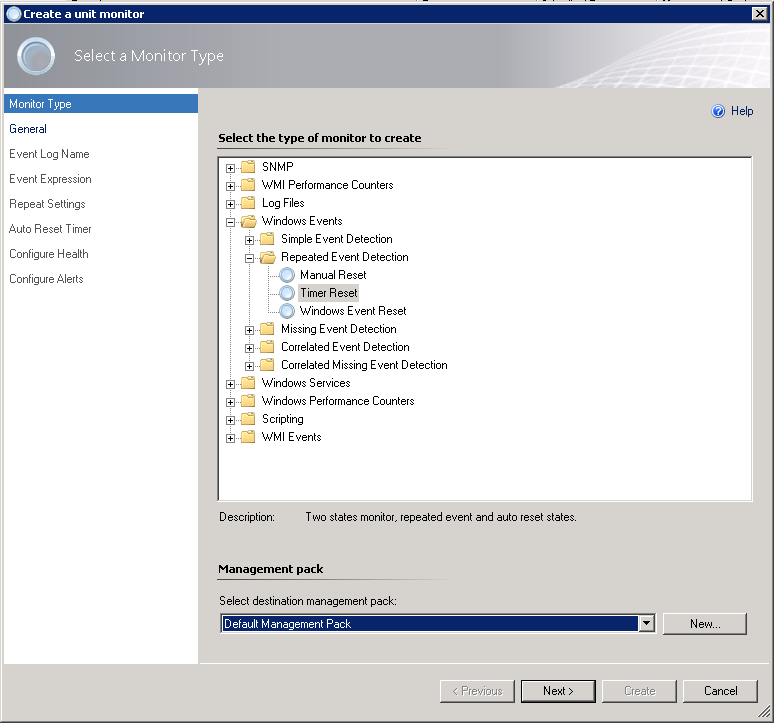
In Event Log Name select the event log you are targeting, in our case it will be Application. Click Next

For Build Event Expression enter in the ID of the event you will be looking for, and the Event Source. Click Next

In the Repeat Settings change the Counting Mode: to Trigger on count, and the Compare Count to 10. Then set the interval time to 5 Minutes. This will go out and check the log for your event and if it finds more than 10 failures in 5 minutes it will generate an alert for this event. Click Next

Next set your Auto Timer Reset to 2 minutes. This means the alert will self resolve after two minutes and close. Click Next

Now we want to configure the health settings for failure and healthy. Change Repeated Event Raised to Critical and Click Next

For Configure alerts go ahead and Check Generate Alerts for this monitor. You can configure your alert and the description as required for your particular situation. Click Create

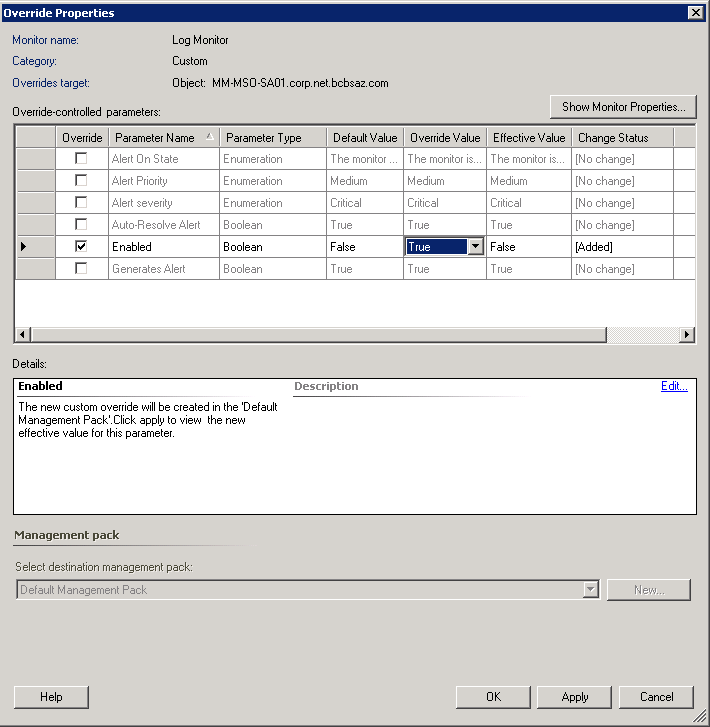
Now we need to enable the monitor for your test server. Right Click on the Monitor and select Overrides, then Override the Monitor then For a specific object of class: Windows Computer. You will be asked for the computer name, select it and Click OK. In the Override check the Enabled check box and change the Override Value to True. Click Apply

Now in Windows Server 2008R2 - How to Create an Event Log Event I showed you how to manually generate events. You can use this to create 10 failures and make sure the monitor is working correctly.


More to come!

Like this blog, give it a g+1

Windows Server 2008R2 - Manually Create an Event Log Event

So leading up to my next SCOM 2012 post How to Generate Alerts From the Event Log I first wanted to go over how to manually create events so you can test your monitoring later. Knowing how to set this up can be helpful for other things besides SCOM. You can use this in your scripting to note in the event log that a script ran, or completed. This trick can be used to write to just about any event log you wish.

The eventcreate command is what you will use to do this. You can pull up a list of switches in eventcreate by using the /? switch.  

Switch Action
/S Specifies the remote system you will be creating the event on
/U The username that will be used to execute the command
/P The password for the username. You will be asked for a password if you do not supply one
/L The event log you want to write to (i.e. System, Security, Application, etc.)
/T Specify the level of criticality of the error, Success, Error, Warning, Information
/SO You can specify the source of the event if needed
/ID You can specify the event ID for this event (between 1 and 1000)
/D This is the description of the event in quotes, "This is a test event"

The example I will be using in my next segment is:
eventcreate /l application /t information /id 1000 /so SCOMTest /d "This is a test event"

This will create an event with the ID of 1000 and a source of SCOMTest in the Application log.


More to come!


Like this blog, give it a g+1

Thursday, March 7, 2013

SCOM 2012 - How to Generate an Alert From a Log File

You may run across situations where you will be required to monitor log files to find specific entries and generate alerts based on those entries. This is actually quite easy to setup in SCOM 2012. You have the ability to comb through both .txt and .csv files and find specific events you can determine.

First go to the Authoring space.Then go to Management Pack Objects then Monitors. Go ahead and scope the list for Windows Computers. Expand out Windows Computers and Entity Health. Right Click on Availability and select Create a Monitor then Unit Monitor...

When the Create a unit monitor wizard opens up expand out Log Files then Text Log then Simple Event Detection. You have three choices here:
  • Event Reset - 2 States, Alert and Auto Resolve
  • Manual Reset - 1 State, Alert - Manually resolve
  • Timer Reset - 2 State, Alert and Auto Resolve (Time based)
For this example we will be using Event Reset which is a 2 State Monitor. Select Event Reset and determine which management pack this will be placed in and Click Next.

For General Properties, give the monitor a Name and a description if you like. The target should be Windows Computer and the Parent monitor should be Availability. I uncheck Monitor is enabled so I can enable it on specific servers later with an override later. Click Next

On the Application Log Data Source enter the path of the log file in Directory. In Pattern enter the name of the log file. If the log file has a static name you can enter it in, if the log file is dynamically generated you can use a wildcard (*) to denote the change. I.E. LogFile*.txt in place of LogFile01.txt, LogFile02.txt etc. Click Next

In Build Event Expression we will be setting the the first state which is the Error State. Click Insert. In Parameter Name type Params/Param[1], the Operator is Contains and the Value is the fail entry on the log file. In our text example it will be the word Down. Click Next

In Application Log Data Source we will be building our Second state which is the recovery state. Once again enter the location of the .txt file in Directory and the name of the file in Pattern. Click Next

For building the second expression Click Insert. Parameter name is Params/Param[1], the Operator is Contains and the Value is the recovery entry on the log file. For the recovery state we will be using the word Up. Click Next

In Configure Health we need to determine which state is which. For First Event Raised change it to Critical. For Second Event Raised Change that to Healthy. Click Next

Now we want to configure alerts for this monitor. Check the Box Generate alerts for this monitor. You can configure the alerts however fits your situation best. Click Create

The final step is to setup an override for the server you want to monitor. Right Click on the Monitor and select Overrides, then Override the Monitor then For a specific object of class: Windows Computer. You will be asked for the computer name, select it and Click OK. In the Override check the Enabled check box and change the Override Value to True. Click Apply

If you go into Health Explorer of the server you will now see under Availability the new monitor you just created. You can test the functionality by manually putting in the failed state criteria in the log file and saving it.


More to come!


If you like this blog, give it a g+1